
Wednesday, August 30, 2006
SCRUM at Unkasoft: the sprint backlog
We've been talking about sprint backlog twice.
In one hand, while we're planning the sprint, we should make the sprint backlog, and in the other hand, during daily scrum, we should update its contents.
 This is the theory, but... How are we making and updating our sprint backlog here at Unkasoft?
We base our work on well-known Juan Palacio's sprint template published time ago (with some final touches made by us).
We've been evaluating some others templates, but they didn't convince us due they was too complex.
In essence, this template is something as virtual board where we drop cards for tasks to be implemented and we move them when they're completed.
During daily scrum, we update each task, making a note of remaining hours to be completed, and the template will plot burndown charts for us.
Basically, the template has three sections:
Configuration:
We note down some general information about the project and the sprint, like number of days for the sprint, number of hours for each working day, kind of tasks (code, meeting, test, documentation...), task states, team members and holidays.
Data:
We write here all tasks extracted durint sprint planning, with estimated hours and the kind of task. For each task, we maintain the number of hours remaining to complete it. So, if one tasks isn't progressing, we'll see this number of days don't decrease, which is a bad thing.
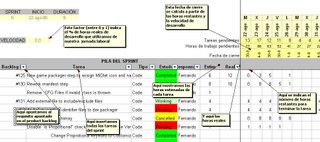 Basing on this data and development speed (a factor between 0 and 1 we've introduced in the template), we can compute estimated release date, different for each day of the sprint. With this date, we can see whether we're behind schedule or not.
Another stuff we've introduced is a column with real hours for each task, which we fill when the task is completed. Although SCRUM doesn't propose this estimate-real hours control, we need it for our budgets and costs.
Charts: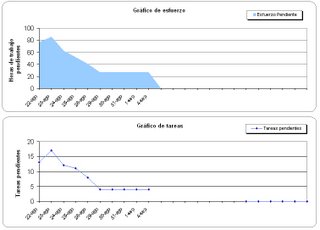
Finally, basing on previous data, we can plot the typical burndown chart and another ones to see how tasks evolve, how release date fluctuates and the work load for each developer.
We could talk for hours about how you can interpret this charts. I recommend you this post about five signs of trouble in an iteration. We've suffered all of them (:
Also, there're more complex charts, in order to manage tasks introduced in the middle of the sprint.
Ok, it's been finishing... next day we'll talk about how we mix SCRUM with eXtreme Programming.
In one hand, while we're planning the sprint, we should make the sprint backlog, and in the other hand, during daily scrum, we should update its contents.
 This is the theory, but... How are we making and updating our sprint backlog here at Unkasoft?
We base our work on well-known Juan Palacio's sprint template published time ago (with some final touches made by us).
We've been evaluating some others templates, but they didn't convince us due they was too complex.
In essence, this template is something as virtual board where we drop cards for tasks to be implemented and we move them when they're completed.
During daily scrum, we update each task, making a note of remaining hours to be completed, and the template will plot burndown charts for us.
Basically, the template has three sections:
Configuration:
We note down some general information about the project and the sprint, like number of days for the sprint, number of hours for each working day, kind of tasks (code, meeting, test, documentation...), task states, team members and holidays.
Data:
We write here all tasks extracted durint sprint planning, with estimated hours and the kind of task. For each task, we maintain the number of hours remaining to complete it. So, if one tasks isn't progressing, we'll see this number of days don't decrease, which is a bad thing.
 Basing on this data and development speed (a factor between 0 and 1 we've introduced in the template), we can compute estimated release date, different for each day of the sprint. With this date, we can see whether we're behind schedule or not.
Another stuff we've introduced is a column with real hours for each task, which we fill when the task is completed. Although SCRUM doesn't propose this estimate-real hours control, we need it for our budgets and costs.
Charts:

Finally, basing on previous data, we can plot the typical burndown chart and another ones to see how tasks evolve, how release date fluctuates and the work load for each developer.
We could talk for hours about how you can interpret this charts. I recommend you this post about five signs of trouble in an iteration. We've suffered all of them (:
Also, there're more complex charts, in order to manage tasks introduced in the middle of the sprint.
Ok, it's been finishing... next day we'll talk about how we mix SCRUM with eXtreme Programming.
posted by JM : 9:44 am


![]()
